Why Grid Layout Deserves Planning
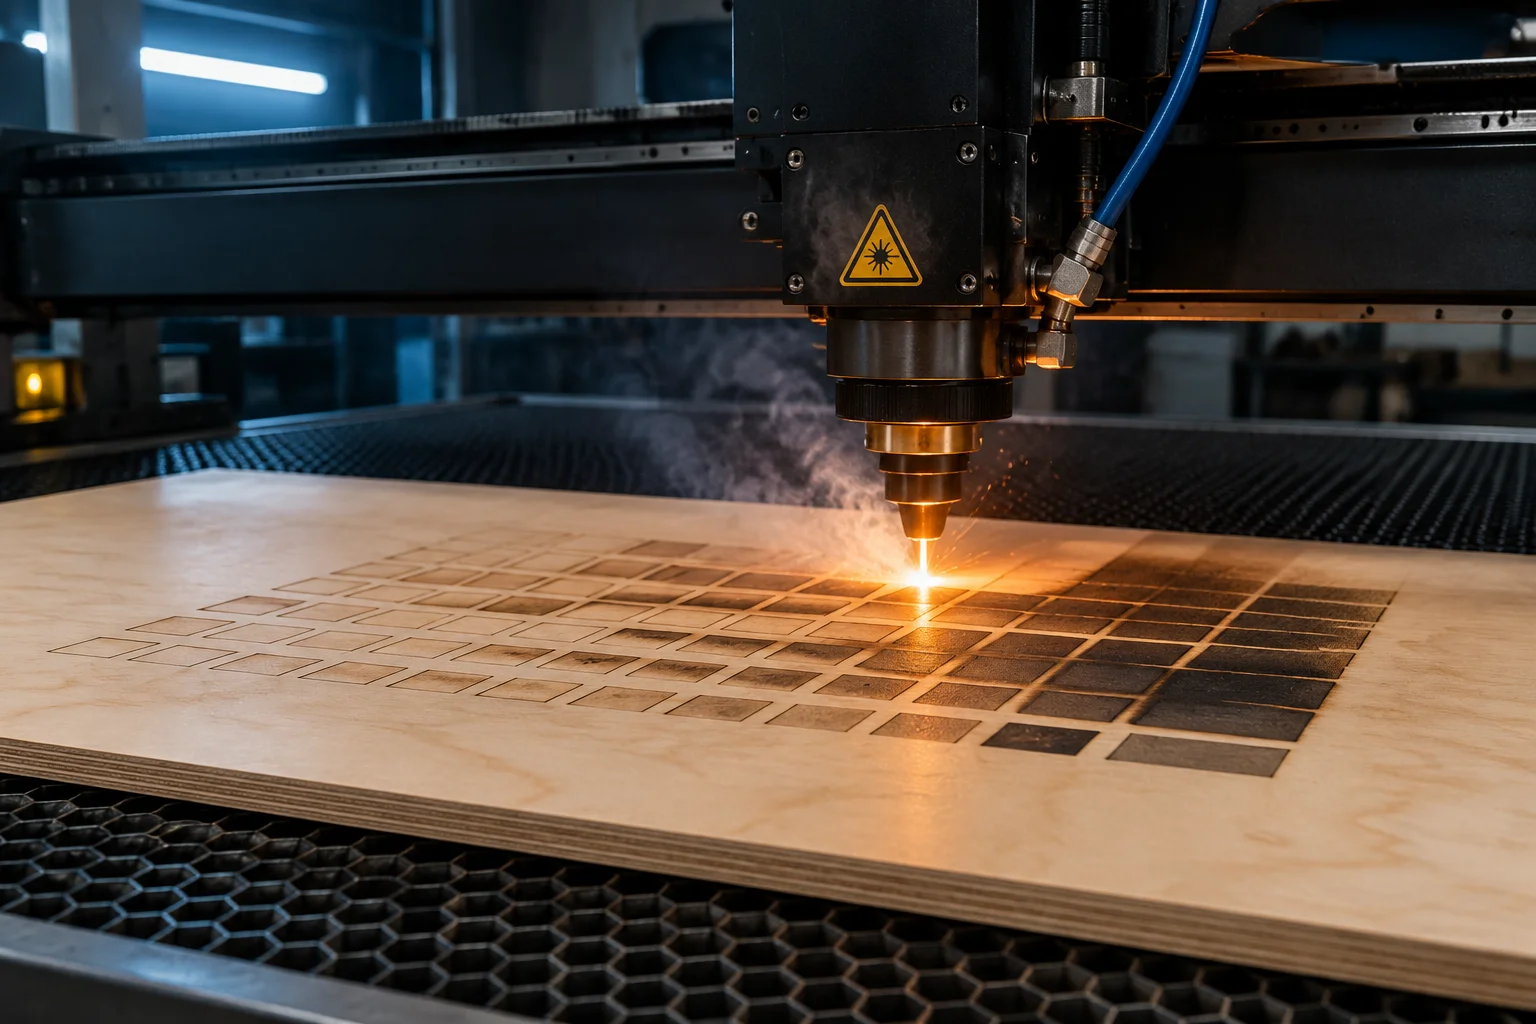
An improvised test pattern often burns a dozen cells that all land in the same thermal regime, leaving the interesting thresholds unexplored. A deliberately designed grid instead distributes its steps so that every region of the working envelope — under-mark, stable mark, and over-burn — receives meaningful coverage.
Planning also protects material. When the grid footprint, orientation, and step distribution are fixed in advance, a single offcut yields a complete picture instead of several partial ones.
Choosing Axes and Step Counts
The classic arrangement maps travel speed on one axis against power on the other, but the pair is not mandatory. Line interval versus passes, or focus offset versus power, can answer different questions. What matters is that the two most uncertain variables occupy the axes while everything else is held constant and logged.
Step count is a trade-off. Fine divisions pinpoint thresholds precisely but shrink each cell until texture noise dominates; coarse divisions keep cells legible but may skip over the boundary entirely. Many practitioners start with a coarse scouting grid, then regenerate a finer grid around the region that mattered.
Spacing, Margins, and Legends
Cells placed too close together let thermal bleed contaminate neighbors and make edge judgments impossible. A visible gutter between cells isolates each sample. Outer margins serve double duty: they keep the array away from stock edges and provide room for the legend.
The legend itself is non-negotiable for archived grids. Axis direction, step values, date, machine, and substrate identifiers should be marked on or beside the array so that a photograph of the sheet remains self-explanatory years later.
Common Layout Mistakes
- Reversed axis assumptions — reading speed increments in the wrong direction inverts every conclusion.
- Legend text burned with the same heavy settings as the cells, leaving labels scorched and unreadable.
- Grids placed on warped or unfinished edges, mixing surface defects into the data.
- Step ranges so wide that half the cells show identical saturated burns.