Optical Contrast Versus Structural Cavity
Visual appraisal of a laser trial coupon frequently deceives the operator. A dark, high-contrast zone on a stainless steel plate suggests profound physical removal to the unaided eye. Microscopic profilometry often reveals that the dark band sits entirely flush with the untouched plane, reflecting an oxide growth layer measuring mere nanometers rather than mechanical relief. Conflating optical reflectance with dimensional ablation corrupts baseline evaluations.
In polymer trials, a stark white mark can represent micro-foaming where volatile bubbles swell above the virgin surface rather than cutting downward. Recording these results simply as an engraving depth creates systemic errors when establishing production tolerances. Separating surface marks from measurement requires rigorous physical probing alongside optical logging.
Precision Caliper and Micro-Depth Instrumentation
Reliable separation requires instruments capable of disregarding surface reflectivity. Digital dial indicators with flat anvils, pointed needle probes, and vernier depth calipers isolate the substrate datum plane from the beam center trench. The baseline material surface serves as the zero point across every cell of the test matrix.
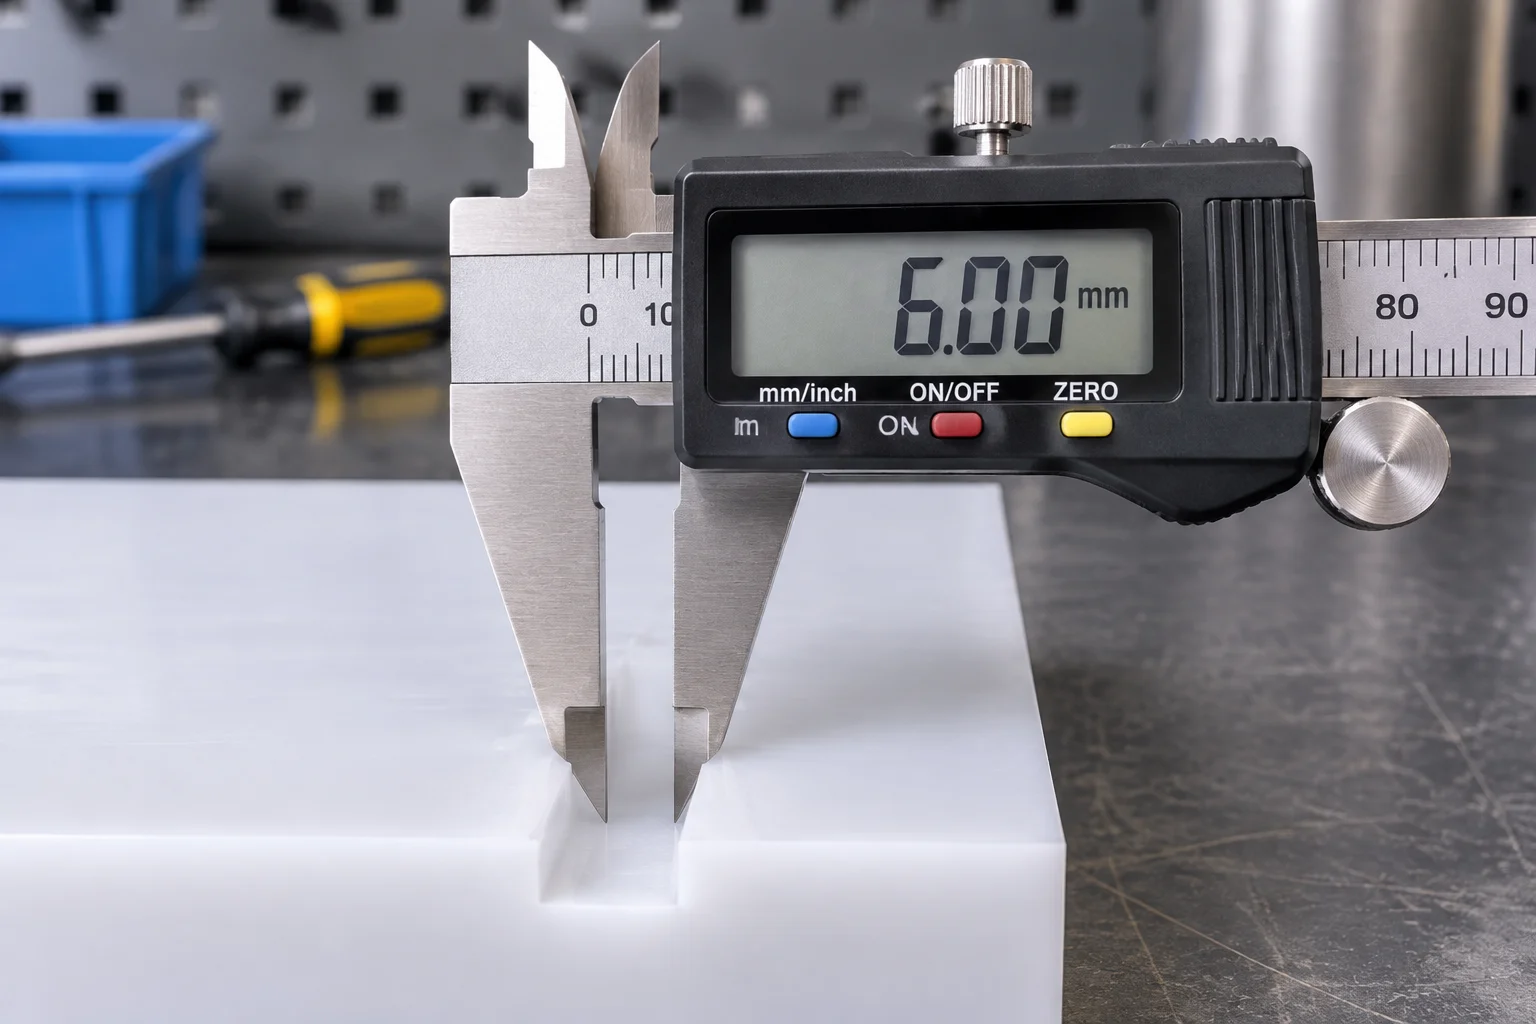
Probing must occur across multiple vectors within each test patch. Transverse traverses identify recast melt lips along the trench edges. If the probe rests on a thermal lip, the measured value reflects artificial elevation rather than genuine beam penetration. Documenting both maximum depth and lip burr height yields complete mechanical profiles.
Empirical Discrepancies Across Test Matrices
Comparative test runs demonstrate how visual appearance diverges from physical relief across common workshop substrates. In controlled tests using 304 stainless steel and cast PMMA sheets, visual contrast scales independently of dimensional displacement.
Morphological Anomalies in Processed Substrates
Evaluating experimental patches highlights recurring behavioral classes where appearance contradicts physical structure:
- Annealed oxide layers on polished steel demonstrate dense optical opacity while physical roughness stays under 0.8 micrometers.
- Cast acrylic vapor cavities produce steep vertical walls, yet recast lip ridges offset absolute depth readings by up to 45 micrometers.
- Cellular expansion in foamed plastics creates elevated crowns rather than recesses, contradicting intuitive depth expectations.
Protocol for Harmonized Ledger Documentation
To prevent distorted records in collective databases, trial sheets must feature dual distinct entry columns. One column logs optical response using standardized grayscale cards or reflectance spectrophotometry. The second column logs mechanical displacement captured with calibrated depth indicators in micrometers.
Cross-referencing both parameters allows process engineers to select settings matching the functional need. When aesthetic labeling is the target, high-contrast flat marks minimize structural fatigue. Conversely, when mechanical clearance, inlay nesting, or tactile indexing is mandatory, true caliper depth remains the sole decisive figure.